KPI Examples: The Ultimate Guide for Better Business Success
Every business owner wants to know one thing: is the company actually moving forward? Revenue might look fine on the surface, customers might seem happy, and the team might appear busy but without the right numbers to track, you’re guessing rather than knowing. That’s where Key Performance Indicators, or KPIs, come in.
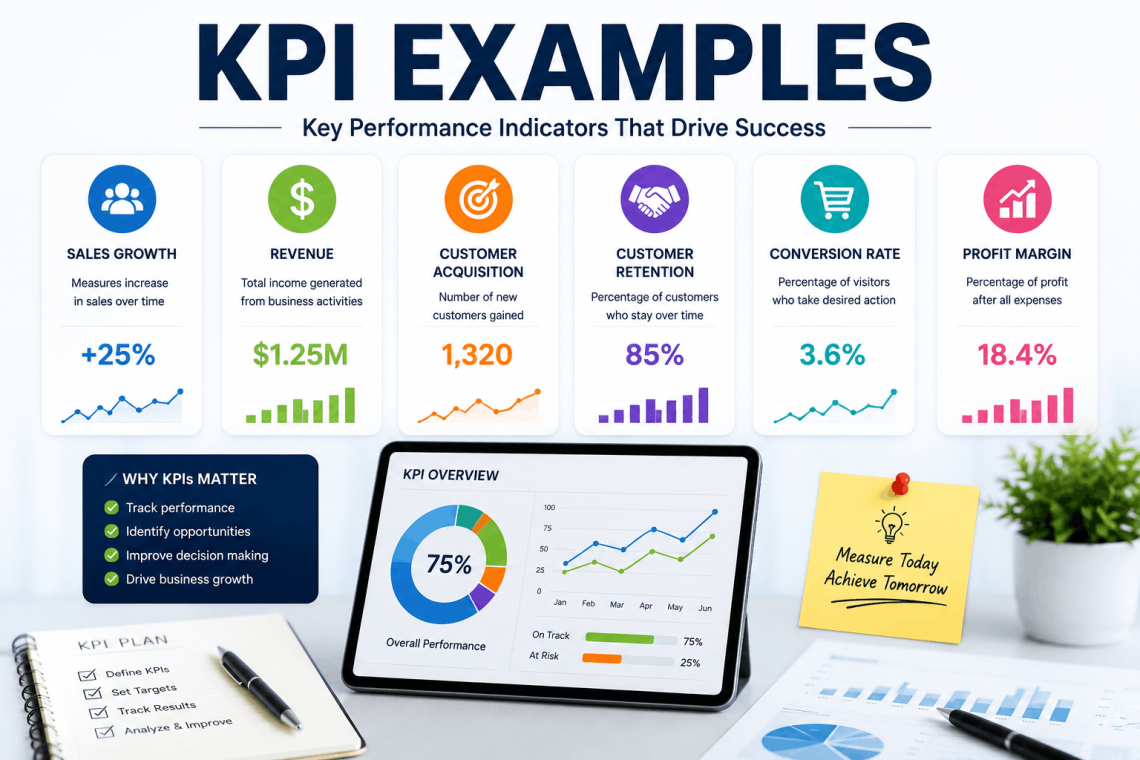
This guide breaks down the best KPI examples across sales, marketing, finance, customer service, human resources, and operations. You’ll learn what each metric measures, why it matters, and how to use it to make smarter decisions. Whether you run a startup or manage a department inside a larger company, these KPI examples will give you a practical framework for measuring what counts.
What Are KPIs and Why Do They Matter?
A Key Performance Indicator is a measurable value that shows how well a business, team, or individual is achieving a specific objective. Unlike generic data points, a KPI is tied directly to a goal. Tracking website visits is just a metric. Tracking website visits against a monthly growth target is a KPI.
The right KPIs giveka clear picture of performance without forcing them to sift through endless spreadsheets. They turn abstract goals like “grow the business” into concrete numbers like “increase monthly recurring revenue by 15% this quarter.” This clarity helps teams stay focused, spot problems early, and celebrate real wins instead of vanity numbers.
Good KPIs share a few common traits. They are specific, measurable, achievable, relevant, and time-bound often summarized as the SMART framework. A KPI that’s too broad or disconnected from a real business goal won’t help anyone make a decision, so picking the right ones matters as much as tracking them consistently.
How to Choose the Right KPIs for Your Business
Not every company needs the same set of metrics. A software startup cares about different numbers than a retail store or a manufacturing plant. Before picking KPI examples from this guide, ask a few questions:
What is the goal behind this metric?
A KPI should always trace back to a business objective, whether that’s increasing profit, improving customer retention, or speeding up production.
Who will use this data?
Executives need high-level numbers like overall revenue growth. Department managers need detailed numbers like cost per lead or average handle time.
How often should it be reviewed?
Some KPIs, like daily active users, need constant monitoring. Others, like annual employee turnover, only need quarterly or yearly review.
Can the data be collected reliably?
A great KPI is useless if the data behind it is inconsistent, manually entered with errors, or pulled from disconnected systems.
Once these questions are answered, you can build a KPI dashboard that actually reflects business health instead of one cluttered with numbers nobody checks.
Sales KPI Examples
Sales teams live and die by numbers, and choosing the right ones can mean the difference between a team that hits quota and one that constantly falls short.
Monthly Recurring Revenue (MRR)
For subscription-based businesses, MRR shows the predictable revenue generated each month. It strips out one-time payments and focuses purely on recurring income, making it one of the clearest indicators of business stability.
Customer Acquisition Cost (CAC)
CAC measures how much it costs, on average, to win a new customer. Divide total sales and marketing spend by the number of new customers acquired in a given period. A rising CAC without a matching increase in customer value is a warning sign worth investigating.
Sales Conversion Rate
This shows the percentage of leads that turn into paying customers. Tracking conversion rate by stage from lead to qualified lead to closed deal helps pinpoint exactly where prospects drop out of the funnel.
Average Deal Size
Knowing the typical value of a closed deal helps sales leaders forecast revenue and set realistic targets for the team. A shrinking average deal size might point to discounting problems or a shift toward lower-value customers.
Sales Cycle Length
This measures the average time it takes to close a deal from first contact to signed contract. Shorter cycles usually mean a more efficient sales process, while longer cycles can reveal friction points worth fixing.
Marketing KPI Examples
Marketing teams need numbers that connect campaign activity to actual business outcomes, not just clicks and impressions.
Cost Per Lead (CPL)
CPL calculates how much money is spent to generate a single lead. Comparing CPL across channels paid search, social media, email shows which campaigns deliver the best return for the budget.
Marketing Qualified Leads (MQL) to Sales Qualified Leads (SQL) Ratio
This ratio tracks how many marketing-generated leads are actually good enough for the sales team to pursue. A low ratio often means marketing and sales aren’t aligned on what counts as a quality lead.
Website Conversion Rate
This shows the percentage of site visitors who complete a desired action, such as filling out a form or making a purchase. It’s one of the most direct ways to measure whether website content and design are actually working.
Customer Lifetime Value (CLV)
CLV estimates the total revenue a business can expect from one customer over the full relationship. Comparing CLV to CAC tells you whether your marketing spend is sustainable long-term.
Organic Traffic Growth
For businesses investing in content and search engine optimization, tracking month-over-month organic traffic growth shows whether SEO efforts are paying off without relying on paid ads.
Financial KPI Examples
Financial KPIs are the backbone of decision-making at the leadership level, giving a clear view of profitability, cash flow, and overall stability.
Gross Profit Margin
This shows the percentage of revenue remaining after subtracting the cost of goods sold. A healthy gross margin gives a business room to cover operating expenses and still turn a profit.
Net Profit Margin
Net margin goes a step further, factoring in all expenses operating costs, taxes, interest to show the true percentage of revenue that becomes profit. It’s one of the most honest indicators of financial health.
Operating Cash Flow
This measures the cash generated from normal business operations. Unlike profit, which can be affected by accounting adjustments, cash flow shows whether a company has enough liquid money to pay bills and reinvest.
Accounts Receivable Turnover
This KPI shows how quickly a company collects payments owed by customers. A low turnover rate can signal collection problems that, left unchecked, create cash flow trouble.
Burn Rate
Especially important for startups, burn rate tracks how quickly a company spends its available cash. Knowing the burn rate alongside current cash reserves tells founders exactly how much runway remains before they need new funding.
Customer Service KPI Examples
Happy customers stick around longer and spend more, which makes customer service metrics directly tied to long-term revenue.
Customer Satisfaction Score (CSAT)
CSAT is typically gathered through short surveys asking customers to rate their experience after an interaction. It’s a quick pulse check on whether support teams are meeting expectations.
Net Promoter Score (NPS)
NPS asks customers how likely they are to recommend a business to others, scored on a scale of 0 to 10. It’s widely used because it correlates strongly with customer loyalty and referral behavior.
First Response Time
This tracks how quickly a support team responds to a new customer inquiry. Faster response times generally lead to higher satisfaction, especially for time-sensitive issues.
Customer Retention Rate
Retention rate shows the percentage of customers who stay with a business over a given period. Since acquiring new customers typically costs more than keeping existing ones, this KPI has a major impact on profitability.
Average Resolution Time
This measures how long it takes, on average, to fully resolve a customer issue from start to finish. It’s a strong indicator of support team efficiency and process quality.
Human Resources KPI Examples
People are often a company’s biggest expense and its biggest asset, so HR teams need metrics that track both cost and culture.
Employee Turnover Rate
This shows the percentage of employees who leave a company within a given period. High turnover often points to deeper issues like poor management, low pay, or weak company culture.
Time to Hire
Time to hire measures how many days it takes to fill an open position from the moment it’s posted to the moment an offer is accepted. Long hiring timelines can cause businesses to lose top candidates to competitors.
Employee Engagement Score
Gathered through surveys, this score measures how connected and motivated employees feel toward their work and the company. Engaged employees tend to be more productive and far less likely to leave.
Cost Per Hire
This calculates the total cost involved in recruiting and onboarding a new employee, including advertising, recruiter fees, and training time. Tracking this over time helps HR teams budget more accurately.
Absenteeism Rate
This shows how often employees are unexpectedly absent from work. A rising absenteeism rate can signal burnout, low morale, or workplace dissatisfaction that needs addressing.
Operations KPI Examples
Operational KPIs keep the day-to-day machinery of a business running smoothly and efficiently.
On-Time Delivery Rate
For businesses that ship products, this measures the percentage of orders delivered by the promised date. Consistent delays can damage customer trust quickly.
Inventory Turnover
This shows how many times inventory is sold and replaced over a set period. A low turnover rate may mean too much capital is tied up in unsold stock.
Production Downtime
This tracks the amount of time equipment or production lines sit idle due to breakdowns or maintenance. Reducing downtime directly improves output and lowers costs.
Order Accuracy Rate
This measures the percentage of orders fulfilled correctly without errors. High accuracy rates reduce returns, complaints, and the cost of fixing mistakes after the fact.
Capacity Utilization
This shows what percentage of total production capacity is actually being used. Businesses running far below capacity may be wasting resources, while those running too close to full capacity risk burnout and quality issues.
Building a KPI Dashboard That Works
Picking strong KPI examples is only half the job. Putting them somewhere visible and easy to understand is what actually changes behavior across a team.
Start by limiting each dashboard to a handful of metrics somewhere between five and ten per team or department. A dashboard with thirty numbers on it tends to get ignored entirely. Group related KPIs together so patterns are easier to spot, and always pair each number with its target so anyone looking at the dashboard knows immediately whether performance is on track.
Review cadence matters too. Daily dashboards work well for fast-moving metrics like website traffic or support tickets, while monthly or quarterly reviews suit slower-moving numbers like profit margin or employee turnover. Set a recurring meeting where the team actually discusses the numbers rather than just glancing at them, since data without discussion rarely leads to action.
Common Mistakes to Avoid When Tracking KPIs
Even well-intentioned teams fall into a few predictable traps when setting up KPIs.
Tracking too many metrics at once.
When everything is “important,” nothing actually gets attention. Focus on the few numbers that genuinely move the business forward.
Choosing vanity metrics over meaningful ones.
Social media followers or total website visits can look impressive while doing little for actual revenue. Tie KPIs to outcomes that matter financially or strategically.
Setting targets without context.
A goal of “increase sales by 20%” means little without knowing last year’s baseline, market conditions, and available resources.
Failing to update KPIs as the bu
siness changes.
A metric that mattered during a company’s early growth phase might be irrelevant once the business matures. Revisit your KPI list at least once a year.
Ignoring the story behind the number.
A KPI tells you what happened, not why. Pair every metric review with a conversation about root causes before jumping to conclusions.